
Thinking about selling your home this Spring?
Spring of 2025 is Definitely a Great Time to Sell Your Home
Hello Buyers and Sellers! Let's dive into the exciting world of real estate metrics and see how they are all connected.
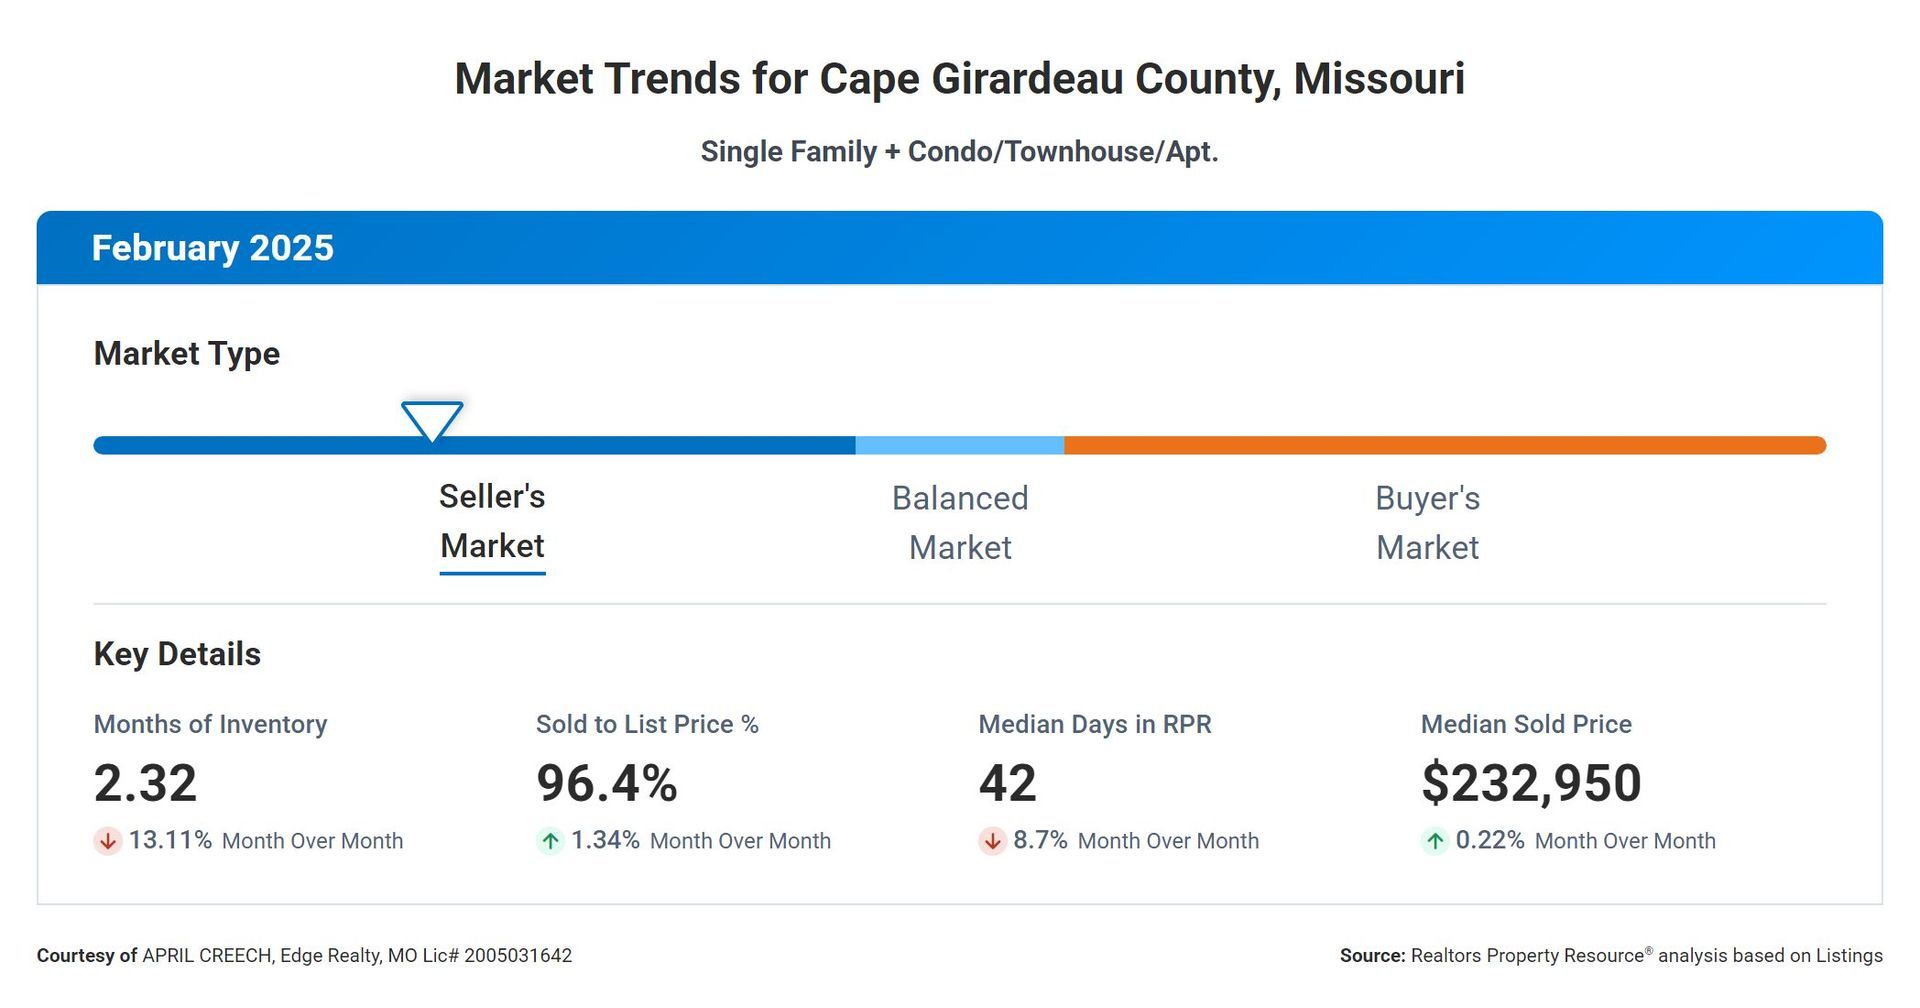
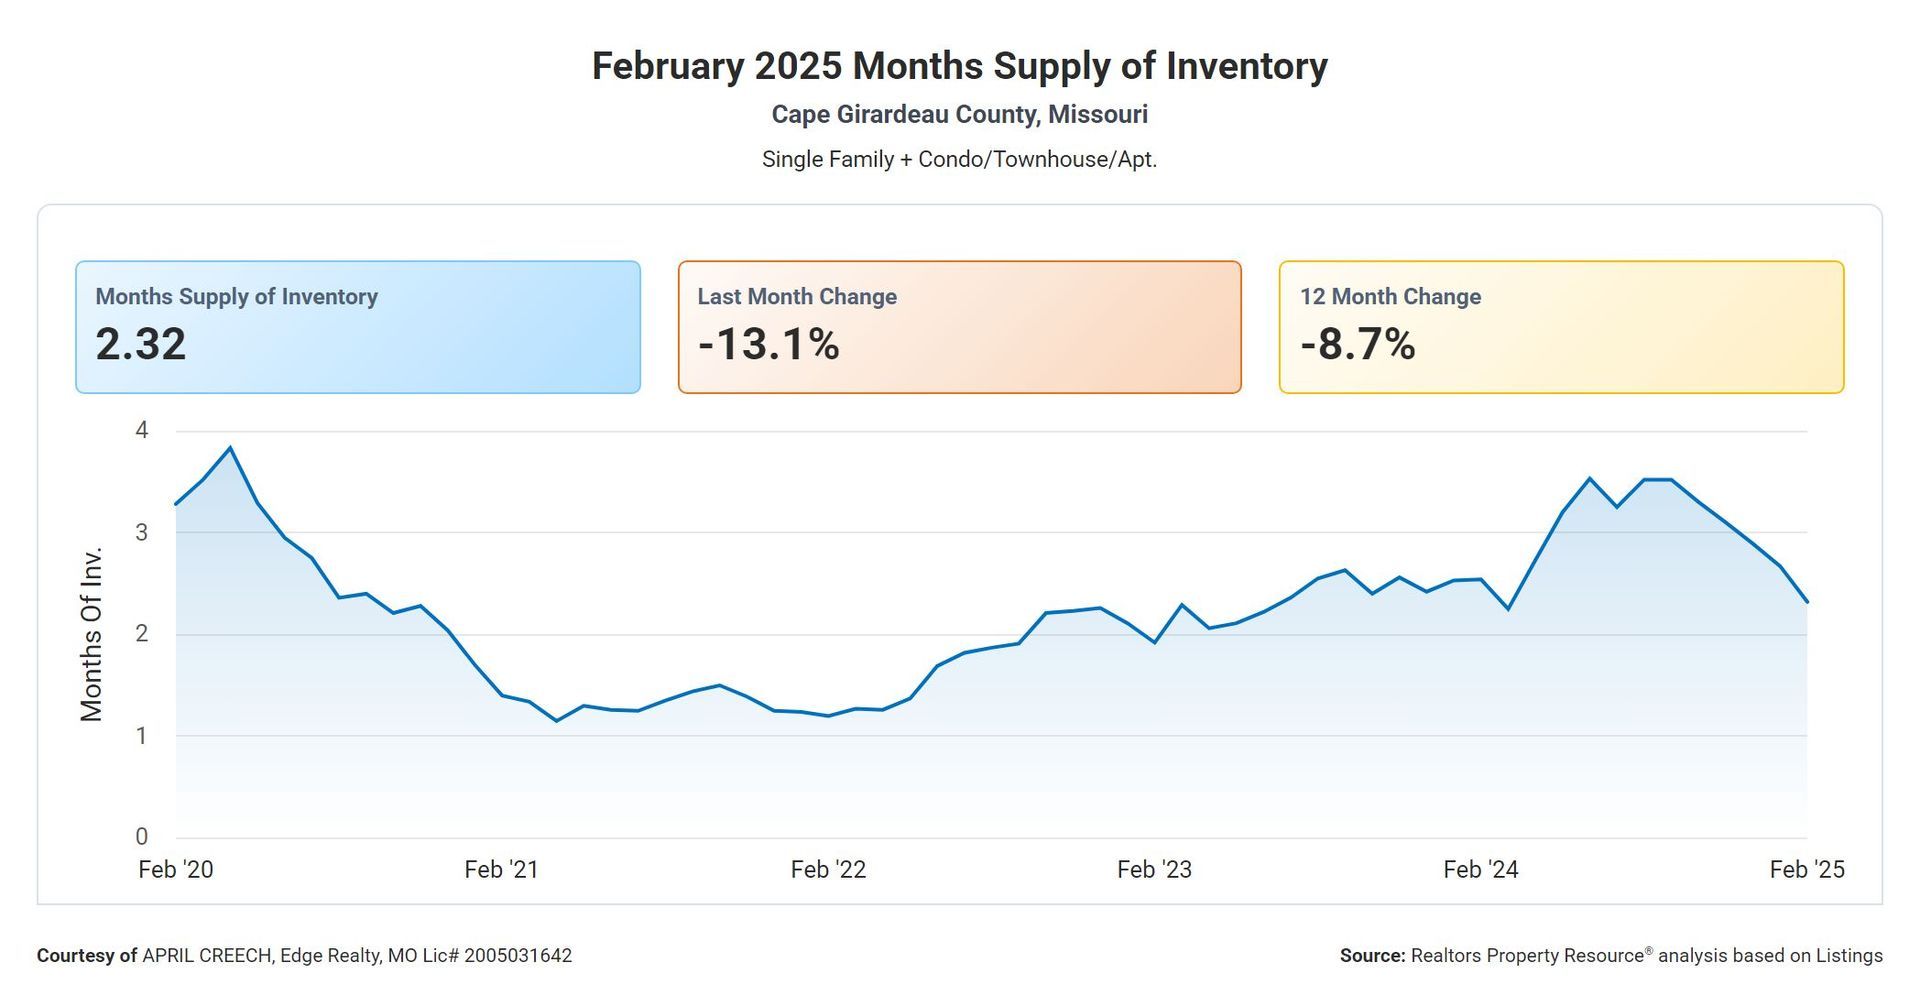
First up, we have the Months Supply of Inventory, which currently stands at 2.32. This means that at the current pace of sales, it would take 2.32 months to sell all the homes on the market. A lower number typically indicates a seller's market, where demand outweighs supply.
Next, we have the 12-Month Change in Months of Inventory, which is at -8.66%. This shows a decrease in the amount of time it would take to sell all the homes on the market compared to a year ago, indicating a tightening of the market. (See graph below)
The Median Days Homes are On the Market is 42, which is a relatively short amount of time. This suggests that homes are selling quickly, possibly due to high demand and low inventory.
The Sold to List Price Percentage is at 96.4%, meaning that on average, homes are selling for 96.4% of their listing price. This indicates a strong market where sellers are able to get close to their asking price.
Lastly, the Median Sold Price is $232,950. This gives us an idea of the average selling price of homes in the area, providing a benchmark for both buyers and sellers.
Overall, these metrics paint a picture of a competitive real estate market with low inventory, quick sales, and strong prices. As a buyer, you may need to act fast and be prepared to make strong offers. As a seller, this could be a great time to list your home and potentially get top dollar. Keep an eye on these metrics as they can provide valuable insights into the market trends. Happy buying and selling!
Share this Post


QUICK LINKS
ABOUT US
CONTACT US
125 East Main Street,
Jackson, Missouri 63755
573-200-0089 Cell
573-335-8111 Office
We are committed to providing an accessible website. If you have difficulty accessing content, have difficulty viewing a file on the website, notice any accessibility problems or should you require assistance in navigating our website, please contact us.